Hyperspectral microscope images appear very similar to a traditional optical microscope image with one important difference. Each pixel of a hyperspectral image provides the complete reflectance spectral response of that pixel’s spatial area within the VNIR or SWIR spectral range. This enables nondestructive spectral measurements of nanoscale elements in the full spatial context of the sample image.
At 100x magnification, a hyperspectral microscope image may contain as many as 700,000 pixels, each as small as 128nm each. This hyperspectral data is recorded at approximately 2nm of spectral resolution in the VNIR range, enabling minute spectral differences to be measured from pixel to pixel within the image.
Imaging spectroscopy can be considered a happy combination of spectroscopy and image processing, and can be seen as an extension of classical image processing. GaiaMicro
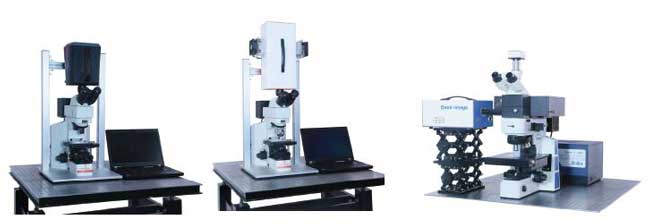
HyperSpectral platform is based on a Metallurgical Microscopy,dual-mode optical device, which allows both image capture for hyperspectral imaging and direct view mode for high-resolution CCD image capture .The HyperSpectral data reveals the spectrum of every pixel in the image,and provides advanced analysis tools to extract quantitative and hidden information from within a sample.In Direct View mode,the system records image details under extremely low intensities and provides a finely detailed high-resolution and high-definition image.
Spectral Imaging describes image acquisition and analysis method which combines spectroscopy, multi-dimensional imaging and computing to delineate the way light reacts with a sample in order to quantify and analyze information that might otherwise be hidden. The underlying principle is the simultaneous measurement of the detailed spectrum of every point of a given area (surface), or more specifically, of each pixel of a given CCD array. Spectral Imaging can be used to obtain fluorescence or bright field spectra, such as absorption, transmission, or reflection.
The spectral image allows you to precisely locate chemical constituents providing unique and
unparalleled insights into the molecular origin, formulation and phase of the observed living entity.The sensitivity range of the spectral image measurement follows the sensitivity of the camera CCD or InGaAs and allows measurements between 400~1000 nm or 900-1700nm, thus covering the whole visible range as well as low near infrared range of electromagnetic radiation. A maximum spectral resolution, comparable with ~3 nm at short wavelengths and increasing to ~5 nm towards the near infrared range, is achieved.
Table:1
|
Instrument model |
GaiaField-Pro-V10 |
GaiaField-Pro-V10E |
|
Spectral Region(nm) |
400-1000 |
400-1000 |
|
Spectral resolution(nm) |
(with 30μm slit) |
(with 30μm slit) |
|
Slit Length(mm) |
9.8 |
14.2 |
|
Slit Width(μm) |
30 |
30 |
|
Numerical Aperture |
F/2.8 |
F/2.4 |
|
Light Transmission |
>50% |
|
|
Spectral Bands |
720(2X Binning) |
720(2X Binning) |
|
CCD Pixels |
1936×1456 |
|
|
Pixel Size(μm) |
4.54×4.54 |
|
|
Digital OutPut(bits) |
8 & 12 |
|
|
Dynamic Range(dB) |
>66 |
|
|
Frame Number(fps) |
15 |
|
|
Exposure Time Range(ms) |
0.0035-1200000 |
|
|
Lens Connector |
C-Mount |
|
|
Power |
DC16.8V |
|
|
Power Consumption(W) |
45 W cooled |
|
|
Cooled Mode |
Wind Cooled |
|
|
Storage Temperature(℃) |
-20~+50 |
|
|
Running Temperature (℃) |
+5~+40 |
|
Table:2
|
Instrument model |
GaiaField-F-N17E-N3 |
GaiaField-F-N17E-HS |
|
Spectral Region(nm) |
900-1700 |
900-1700 |
|
Spectral resolution(nm) |
5(with 30μm slit) |
5(with 30μm slit) |
|
Slit Length(mm) |
14.2 |
14.2 |
|
Slit Width(μm) |
30 |
30 |
|
Numerical Aperture |
F/2.0 |
F/2.0 |
|
Light Transmission |
>50% |
>50% |
|
Spectral Bands |
100-200 |
200-300 |
|
Pixels |
320x256 |
640×512 |
|
Pixel Size(μm) |
30mm×30mm |
20umx20um |
|
Digital OutPut(bits) |
14 |
14 |
|
Frame Number(fps) |
100 |
100 |
|
Exposure Time Range(ms) |
5us-1s |
1us-40ms in high gain mode |
|
Gain Mode |
High/Low |
High/Low |
|
Signal Connector |
Ethernet port/USB |
USB2.0 |
|
Lens Connector |
C-Mount |
C-Mount |
|
Cooled mode |
Cooled TE3 |
Cooled TE3 |
|
Power(detector) |
+12V |
12VDC |
|
Power Consumption(W) |
< 4 W without TEC operation Max. 30 W with TE3-cooling |
60 |
|
Storage Temperature(℃) |
-45~+85 |
|
|
Operating Temperature (℃) |
-40~+70 |
|

Hyperspectral microscope images can be captured of both biological and materials-based nanoscale samples. These nanoscale materials may be integrated in a wide range of biological or materials based environments. See below an example of lesion in glomerular cell. In this example, hyperspectral imaging makes it possible to quickly identify and map the difference present in the tissue and provides a class distribution confirming the total area where lesion are present.
Microscopic hyperspectral imaging "no contact" and "no damage" detection on biological tissues. It can really realize the comprehensive analysis target of "where, what and how much" for biological tissue and qualitative detection target, provide quantitative and positioning description, so as to realize auxiliary diagnosis of some diseases.With the improvement of system spatial resolution and spectral resolution, can analysis biological tissue biochemical from the angle of molecular, and find out the pathogenesis of response for some organizations achieve automatic analysis and auxiliary medical researchers, and quantitative evalsuation effect of the medication.
Combined with blood cells morphological characteristics and the existing method of blood cell analysis, researchers research the data of the normal blood / leukemia blood of hyperspectral imaging.The characteristics of red blood cells, lymphocytes,leukemia cells were analyzed by microscopic hyperspectral imaging, and the implementation of the diseased cells segmentation and morphological parameter quantitative calculation.

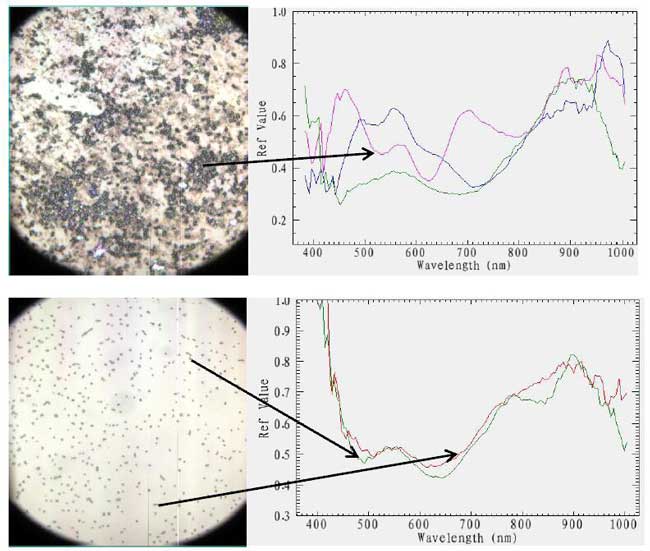
Figure Vis-Nri Microscopic hyperspectral imaging and spectral of bacillus cell

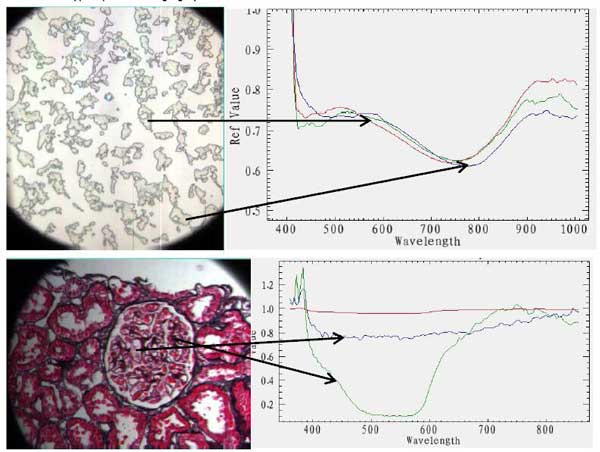
Figure Vis-Nri Microscopic hyperspectral imaging and spectral of glomerular cell
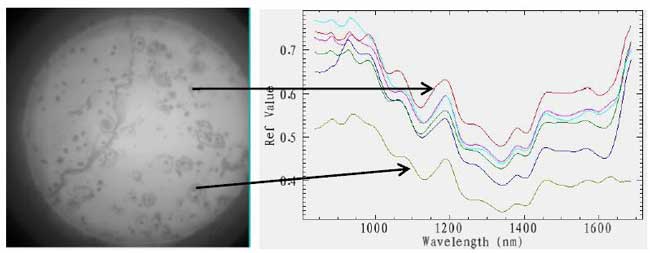
Figure Near infrared microscopic hyperspectral imaging and spectral characteristics of cells, nuclei, blood stains, bacillus cell and mutton tissue sections
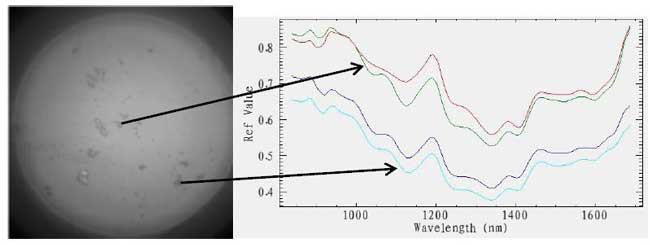
Figure Near infrared microscopic hyperspectral imaging and spectral characteristics of blood stains
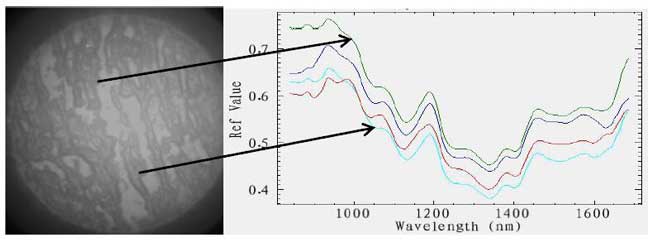
Figure Near infrared microscopic hyperspectral imaging and spectral characteristics of mutton tissue
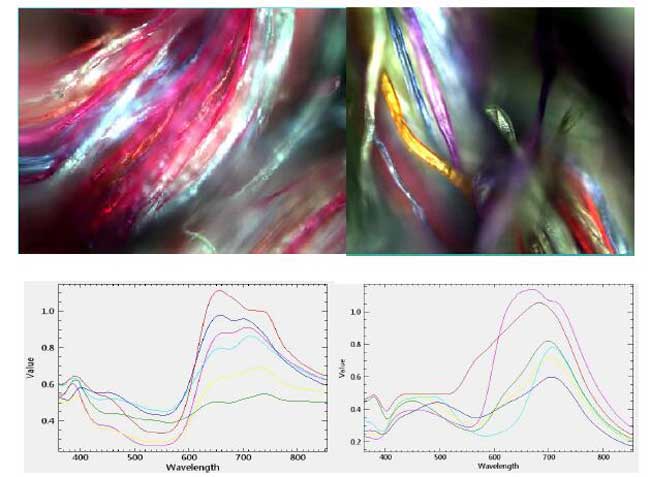
Figure A hyperspectral microscope shows the spectral and imaging of fabric (20x)


 地址:北京市海淀区中关村大街19号新中关B座北翼1701-1706室
.png) 电话:010-62634840
电话:010-62634840
.png) 传真:010-82618238
传真:010-82618238
.png) 邮箱:info@xpjxsb.com
邮箱:info@xpjxsb.com